Tableau Reporting - Best Practices with Examples
Tableau Reporting Best Practices ensure efficient and insightful data visualization. First, focus on data quality, cleansing, and structuring for accurate analysis. Utilize meaningful titles, labels, and tooltips to enhance clarity. Employ simple and consistent color schemes for easy interpretation. Maintain a clean dashboard layout, avoiding clutter and distractions. Use appropriate chart types; for instance, bar charts for comparisons and line charts for trends. Implement interactivity with filters and actions to allow users to explore data dynamically.
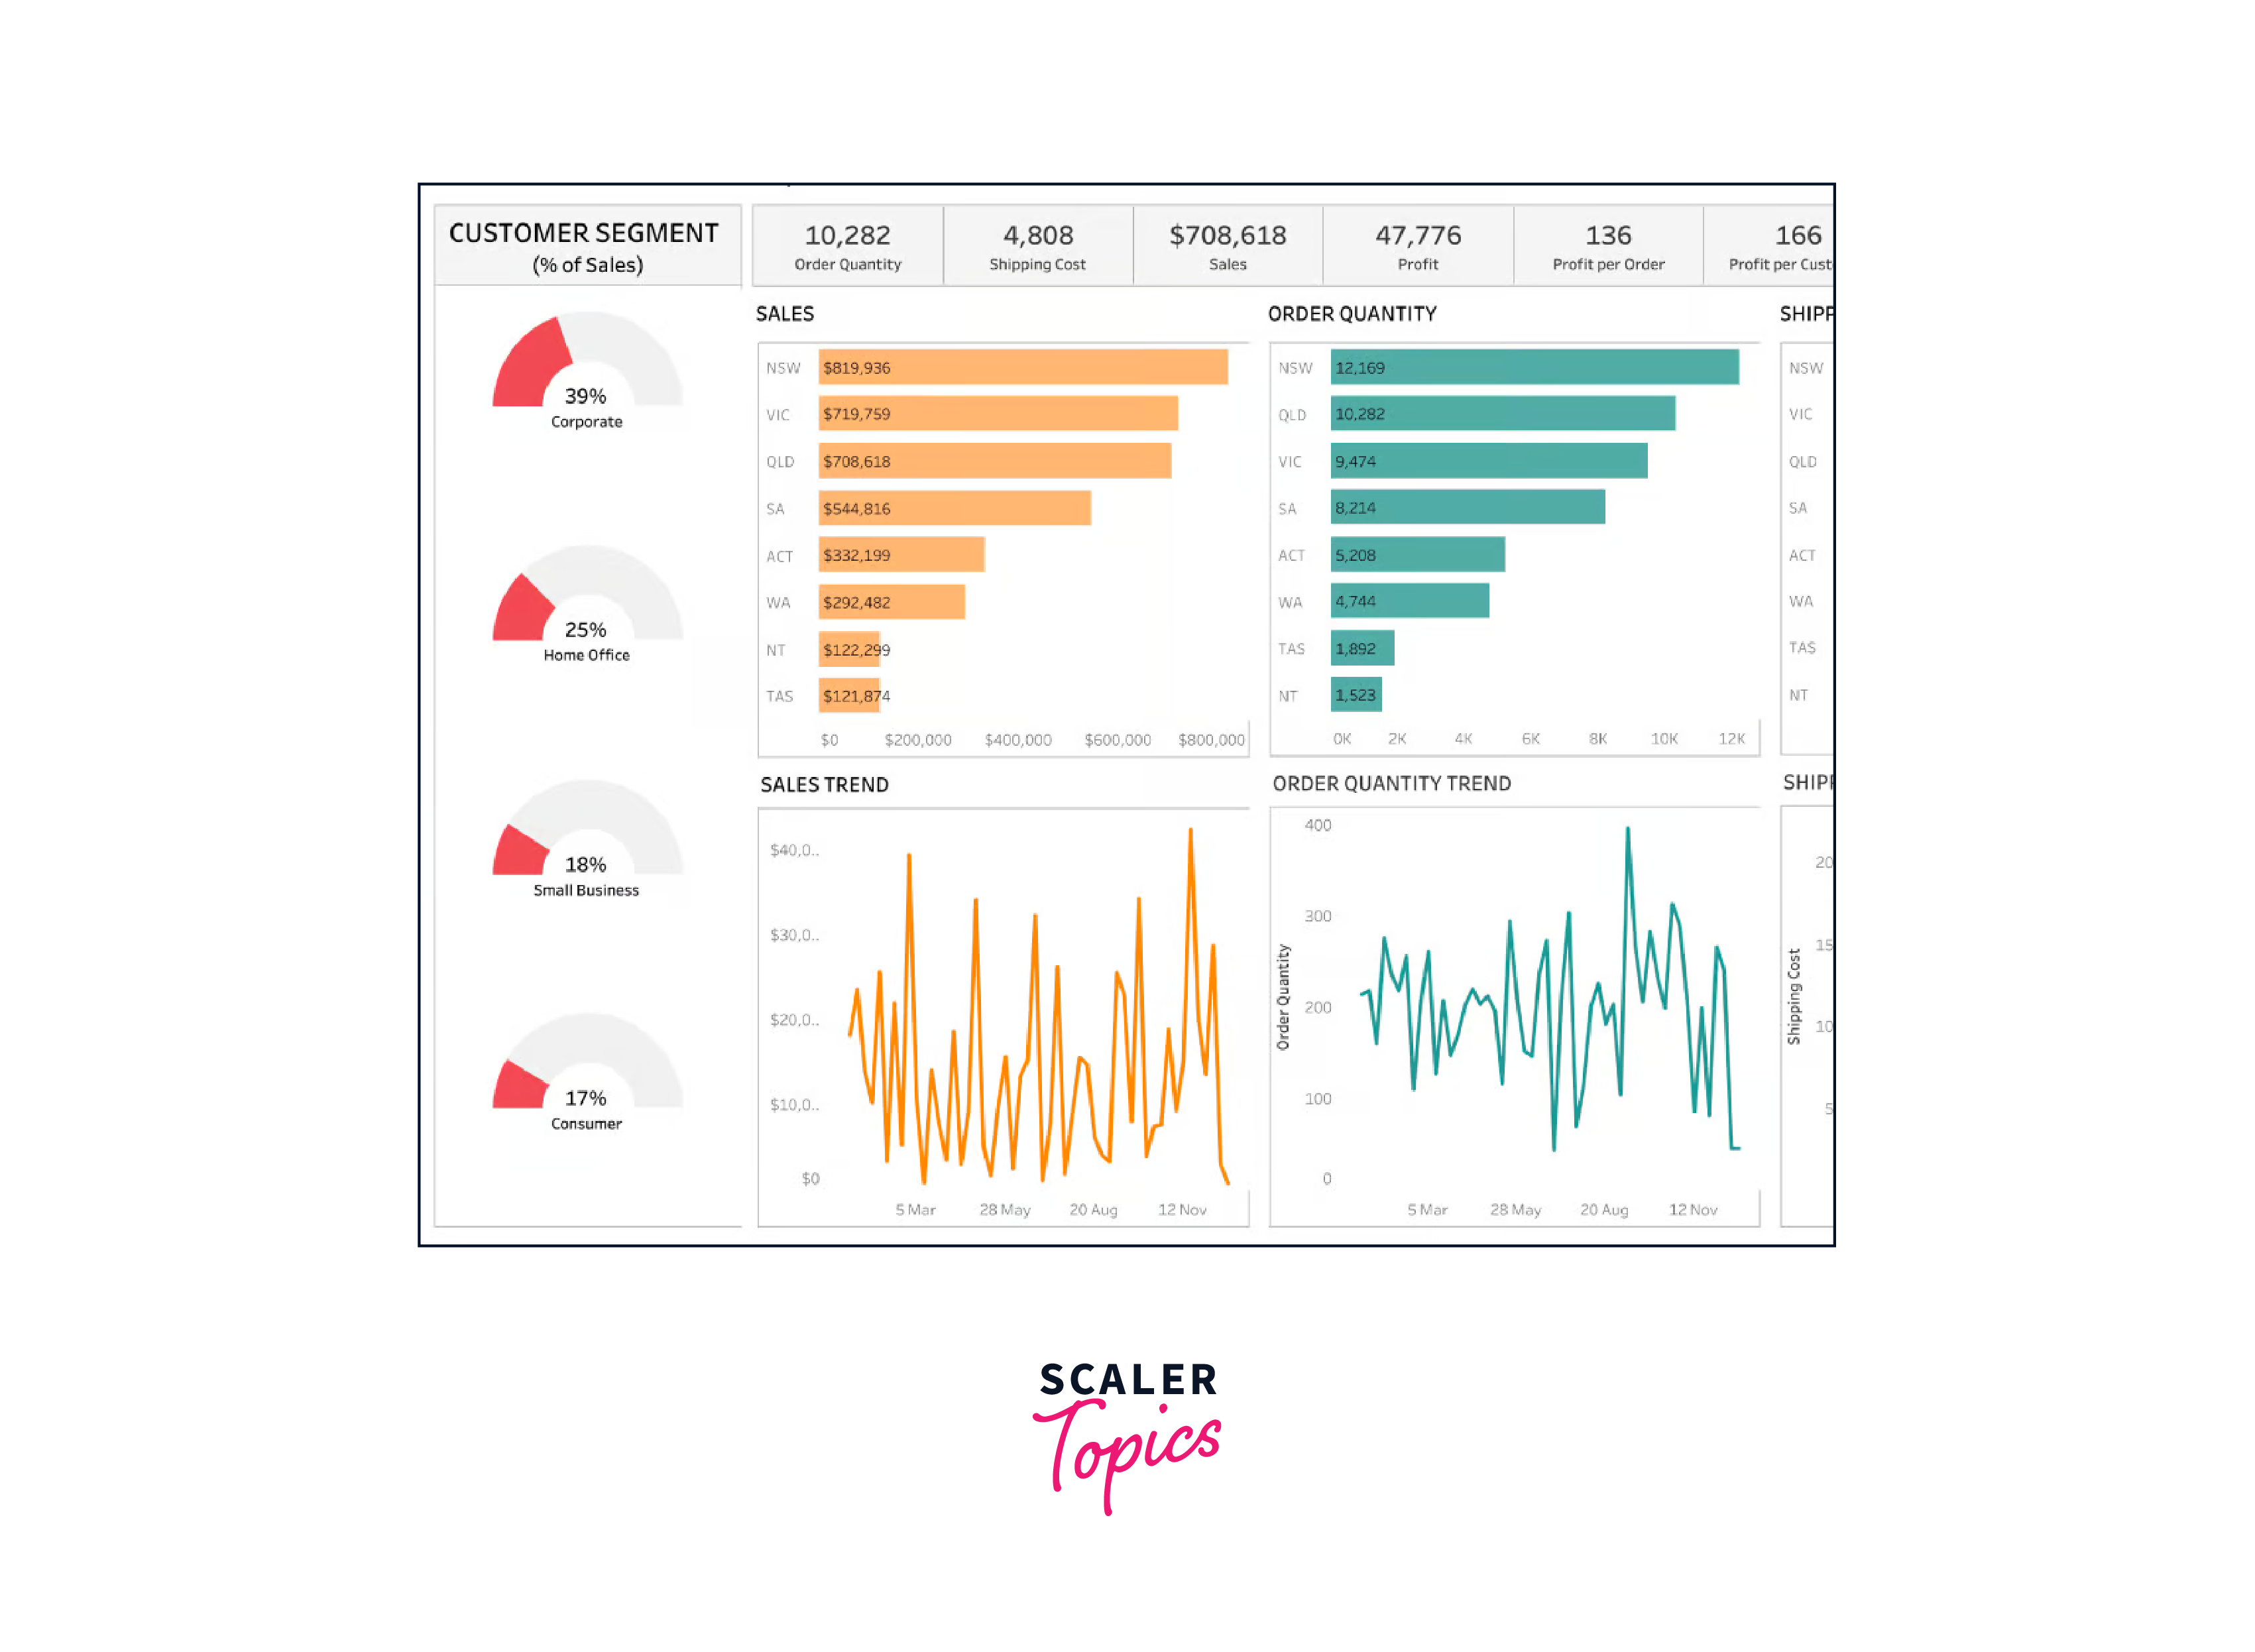
Report Making with Tableau
Creating reports with Tableau is a powerful way to visually analyze and communicate data insights effectively. Here's a step-by-step guide on how to make a report using Tableau:
- Data Connection:
- Begin by connecting Tableau to your data source. Tableau supports various data formats, including Excel, SQL databases, and cloud-based platforms like Google Sheets and Salesforce .
- Data Preparation:
- Clean and transform your data within Tableau using Data Source or Data Prep tools. Ensure data quality by handling missing values, duplicates, and outliers.
- Drag and Drop:
- Start building your report by dragging fields from your data source onto the Columns and Rows shelves. Tableau will automatically generate an initial visualization based on your selection.
- Choose Visualization:
- Select the appropriate visualization type (e.g., bar chart, line chart, scatter plot) that best represents your data and insights. You can change the chart type from the " Show Me " panel.
- Customize Visuals:
- Customize your visuals by adding labels, colors, and formatting. Adjust axes, legends, and tooltips to enhance clarity and aesthetics.
- Filters and Parameters:
- Add filters and parameters to allow users to interact with the data dynamically. This helps users explore different aspects of the data and gain insights.
- Dashboard Creation:
- Combine multiple visualizations, filters, and text objects into a dashboard. Arrange them to tell a cohesive data-driven story. Ensure a clean and intuitive layout.
- Interactivity:
- Set up interactivity between different elements on the dashboard using actions. For instance, clicking on a data point in one visualization can filter data in another.
- Annotations and Insights:
- Use annotations, reference lines, and trend lines to highlight key points in your data. Add text or images to provide context and insights.
- Performance Optimization:
- Optimize your report's performance by limiting unnecessary calculations and aggregations. Consider using data extracts for large datasets.
Important Steps to Take
Creating a Tableau report for data analysis involves several important steps to ensure that your insights are accurate, meaningful, and effectively communicated. Here are the key steps to follow:
- Define Objectives:
- Begin by clearly defining the objectives of your data analysis. What questions are you trying to answer, and what insights are you looking to gain? This will guide your report creation process.
- Data Gathering:
- Collect and organize the relevant data from your data sources. Ensure that the data is complete, clean, and well-structured. Use Tableau's data preparation tools if necessary.
- Connect to Data:
- Import your data into Tableau by connecting to the appropriate data source. Tableau supports a wide range of data formats, databases, and cloud services.
- Data Exploration:
- Explore your data within Tableau. Use the Data Source tab to understand the data structure, preview data, and identify potential issues.
- Data Cleaning and Transformation:
- Cleanse and transform your data as needed. Address missing values, outliers, and inconsistencies. Create calculated fields or pivot data if it improves analysis.
- Data Modeling:
- Define relationships between data tables if you have multiple data sources. Ensure that your data model supports the analysis you intend to perform.
- Select Visualizations:
- Choose appropriate visualizations (e.g., bar charts, scatter plots, heat maps) based on the nature of your data and analysis goals. Tableau's "Show Me" feature can help with suggestions.
Tableau Worksheet
Here's a step-by-step guide on how to use a Tableau worksheet in the process of creating a data analysis report:
- Connect to Data:
- Start by connecting Tableau to your data source, whether it's an Excel file, a database, or an online data service. Click on the " Connect to Data " button, select your data source, and import the necessary tables or data.
- Drag and Drop Dimensions and Measures:
- After connecting to your data source, you'll see a canvas for your worksheet. On the left-hand side, you have a list of dimensions (categorical data) and measures (numeric data). Drag and drop these fields onto the Rows and Columns shelves on your worksheet.
- Choose Visualization Type:
- Tableau offers a wide range of visualization types. Select the one that best suits your data and analysis objectives. You can switch between visualization types using the " Show Me " panel.
- Customize Visualizations:
- Customize your visualizations by adding labels, colors, and formatting. Right-click on various elements to access formatting options and adjust the appearance of your charts.
- Sort and Filter Data:
- Use sorting and filtering options to focus on specific data points or trends within your worksheet. You can sort columns, apply filters, and use quick filters for interactivity.
- Add Reference Lines and Annotations:
- Enhance your analysis by adding reference lines, trend lines, or annotations to highlight key insights in your data. These elements provide context to your visualizations.
Save, Delete, and Reorder
- Saving:
- Best Practice:
Save your Tableau workbooks, worksheets, and dashboards regularly to prevent data loss and maintain version control. Use meaningful and consistent naming conventions.
- Example:
Suppose you're working on a sales analysis report. Save it with a clear title, such as " Sales_Analysis_Report_v1.twbx ". Increment the version number with each significant update.
- Deleting:
- Best Practice:
Delete elements (worksheets, dashboards, or fields) that are no longer relevant or necessary to maintain a clean and focused reporting environment.
- Example:
In your dashboard, you initially added a chart that didn't provide valuable insights. To maintain clarity, delete the chart by right-clicking on it and selecting " Delete ".
- Reordering:
- Best Practice:
Carefully arrange worksheets and dashboards to guide users through a logical flow of information. Place the most critical elements at the beginning for immediate impact.
- Example:
In a sales performance dashboard, reorder the worksheets so that the summary dashboard appears first, providing an overview of key metrics. Subsequent worksheets can dive deeper into specific aspects, such as regional performance or product analysis.
- Hiding vs. Deleting:
- Best Practice:
When considering whether to hide or delete an element, prefer hiding if there's a possibility of needing it in the future. Hiding preserves the work you've done, whereas deleting removes it permanently.
- Example:
You have a chart that's not currently relevant but might be needed for a seasonal report later. Instead of deleting it, right-click and choose " Hide " to remove it from the view but keep it accessible.

Examples
- Example of Consistent Color Coding:
- In a pie chart, different product categories are consistently color-coded, e.g., " Electronics " is always represented in blue.
- Example of Effective Use of Tooltips:
- Tooltip:
When hovering over a data point in a scatter plot, it displays additional information such as customer names and sales figures.
- Example of Proper Scaling of Axes:
- The Y-axis in a line chart starts at zero to accurately represent temperature fluctuations over time.
Why Use Tableau for Reporting?
Tableau is a popular choice for reporting and data visualization for several compelling reasons:
- Ease of Use:
Tableau's user-friendly interface allows both technical and non-technical users to create complex reports and visualizations with minimal training. It offers a drag-and-drop functionality that simplifies data analysis and reporting.
- Interactive Visualizations:
Tableau excels at creating interactive reports. Users can filter, drill down, and explore data dynamically, gaining deeper insights by interacting with the visualizations. This interactivity enhances the user experience and promotes data exploration.
- Wide Range of Data Sources:
Tableau can connect to various data sources, including databases, spreadsheets, cloud-based platforms, and web data connectors. This versatility enables users to access and analyze data from diverse sources within a single interface.
- Rich Visualization Options:
Tableau provides a vast library of visualization types, from basic bar charts to advanced heat maps and geographical maps. Users can choose the most suitable visualization to effectively convey their data's insights.
- Advanced Analytics and Calculations:
Tableau offers powerful analytics capabilities, allowing users to create calculated fields, aggregations, and complex calculations. This facilitates in-depth data analysis and the creation of custom metrics.
- Dashboard Creation:
Users can combine multiple visualizations, filters, and text objects into interactive dashboards. This feature enables the creation of comprehensive and customized reports that tell a cohesive data-driven story.
- Real-Time Data Integration:
Tableau can connect to real-time data sources, providing the ability to create reports and dashboards that update in near real-time. This is crucial for organizations that require up-to-the-minute insights.
- Data Security and Governance:
Tableau offers robust data security and governance features. Organizations can control user access, permissions, and data source connections, ensuring that sensitive data remains secure.
FAQs
Q. Why is it important to use clear and descriptive titles in Tableau reporting?
A. Clear titles provide context and help users understand the purpose of the report.
- Example:
A title like "Monthly Sales Performance Dashboard" clearly indicates the content of the report.
Q. How can I maintain consistency in color coding across different visualizations?
A. Use a consistent color palette for similar data categories.
- Example:
Use shades of green for "Profit" in all charts to maintain consistency.
Conclusion
- Clear Communication:
Clear and descriptive titles, consistent color coding, and effective use of tooltips ensure that reports convey their purpose and insights.
- Accuracy and Precision:
Proper scaling of axes and attention to detail prevent data distortion and provide accurate representations.
